Under Pressure: Mind the Instruction Cache
Table of Contents
This post is about the instruction cache, and what happens when a hot loop runs through more code than fits in it. It’s also about how a design decision that looks purely structural - whether a program processes one item at a time or a batch at a time - can decide how fast it runs, in a way no compiler will fix for you. The last part looks at high-performance networking, where this decision has shaped the architecture of real packet processors.
The instruction cache #
Caches don’t only hold data. The front end of the core - branch prediction, fetch, decode - pulls instructions through its own L1 instruction cache, split from the data side: on a recent x86-64 core that’s 32KB, 8-way, 64-byte lines, the same set-indexed structure as L1d, just holding code. In front of it sits a cache of already-decoded micro-ops (the op cache on AMD, the uop cache / DSB on Intel), a few thousand entries, and behind it the unified L2, a dozen or so cycles away. A miss in L1i is worse than its latency suggests: the out-of-order back end can keep working through a data miss as long as it has independent instructions, but an instruction fetch miss means there are no new instructions to work on, so the whole pipeline drains while it waits.
Most of the time this is invisible - hot code is small, the fetch prefetcher (steered by the branch predictor) runs ahead of sequential code, and what’s hot stays resident. It stops being invisible once a loop cycles through more code than the cache can hold: with a roughly LRU replacement policy, a cyclic working set even slightly larger than capacity evicts every line just before it’s needed again, so the miss rate jumps from near zero to nearly every line.
A benchmark, and a wrong turn #
To make that concrete: two ways to run the same N small functions over a batch of floats. Fused - for each item, call all N functions on it before moving to the next item. Staged - for each function, call it on every item before moving to the next function. Same math per item either way, same order of operations, just different loop nesting.
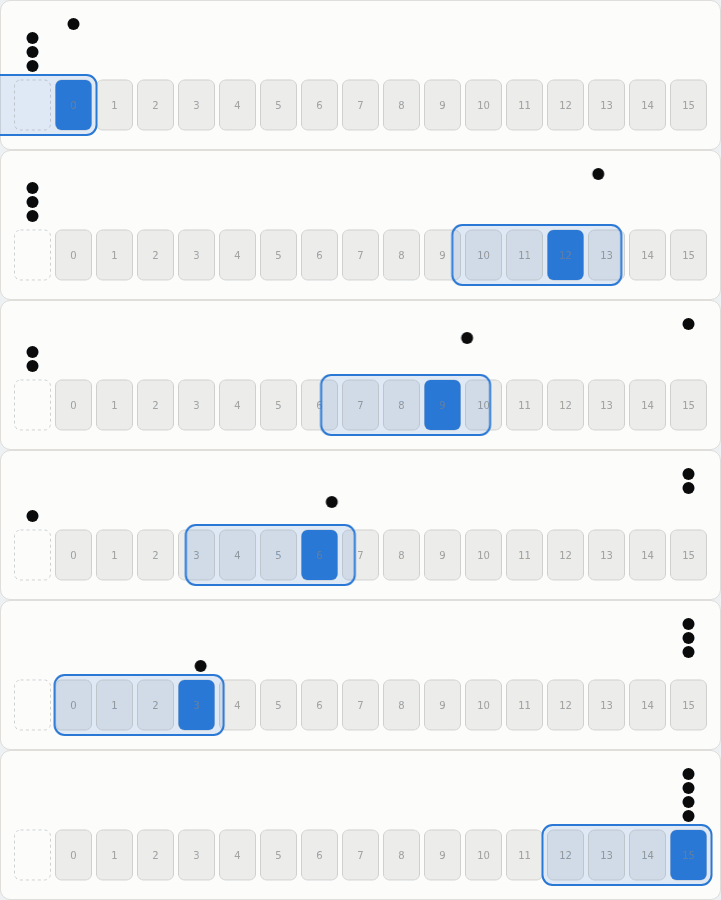
Fused. One item runs every instruction, start to finish, before the next one begins - the window slides the whole way through and has to start cold again for each item.
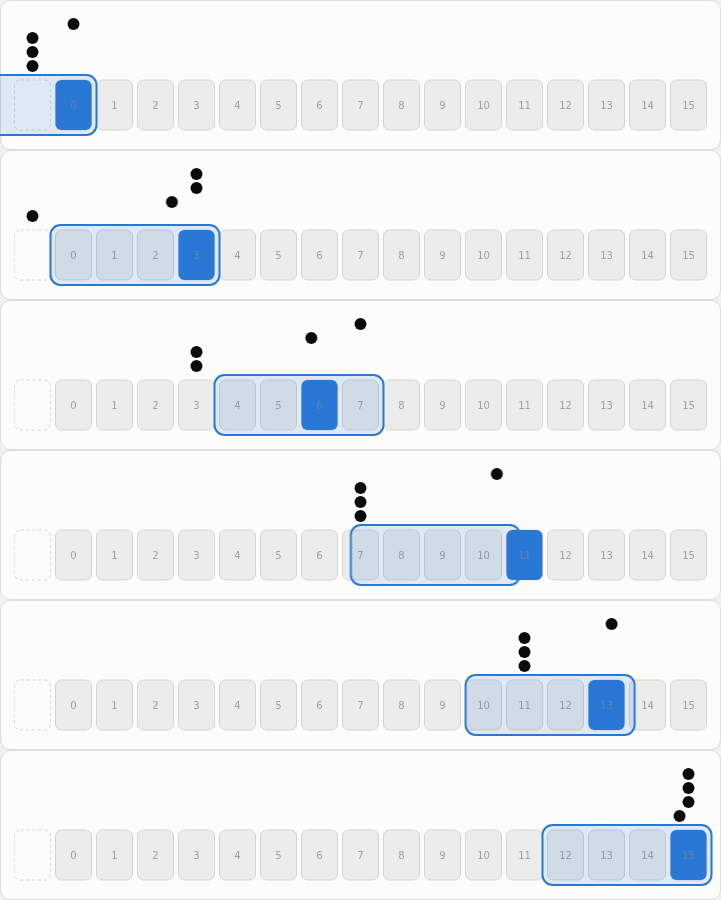
Staged. One instruction’s worth of code stays hot while every item takes its turn through it - only the first item pays to fetch it.
The first version dispatched through an array of function pointers -
ops[j](x) in a loop. Fused came out close to 3x slower than staged,
which looked like confirmation of exactly the theory above: fused
repeatedly cycles through all N functions’ worth of code, more than fits
in L1i, while staged only ever needs one function’s code hot at a time.
Case closed, except it wasn’t.
Checking the actual counters told a different story. L1-icache-load-misses
barely differed between the two versions - a couple thousand either way.
What differed by a factor of 25 was branch-misses: fused sat around a
20% misprediction rate on the indirect call, staged under 1%. The
slowdown was real. It just wasn’t instruction cache pressure - it was the
CPU’s indirect-branch predictor failing to learn a repeating sequence of
96 different call targets, a completely different mechanism that happens
to produce a similarly-shaped number.
Isolating the actual effect #
To take the branch predictor out of the picture, I replaced the function pointers with direct calls. The benchmark now generates 96 functions and calls each one by name, in both loop orders, so every call target is known at compile time and no lookup through a table is needed. Each function also has a genuinely distinct body. Identical bodies get folded into one by the toolchain, which would have quietly undone the whole setup. A direct call doesn’t need branch target prediction the way an indirect one does, so that confound goes away on its own.
With that fixed, branch-misses came back nearly identical between the two versions - noise, not signal. Icache-load-misses did not:
| nitems | mode | time | icache misses | speedup |
|---|---|---|---|---|
| 2000 | fused | 0.0059s | 4377 | 1.00x |
| 2000 | staged | 0.0018s | 1861 | 3.28x |
| 20000 | fused | 0.0567s | 40774 | 1.00x |
| 20000 | staged | 0.0187s | 1688 | 3.03x |
| 200000 | fused | 0.5809s | 287836 | 1.00x |
| 200000 | staged | 0.1864s | 6449 | 3.12x |
(full code in icache-pipeline if you want the generator script and
bench.sh that produced this)
The miss counts are the part worth sitting with, more than the times. Fused’s icache misses scale roughly linearly with item count, because every single item re-triggers the same fetch churn across all 96 functions. Staged’s barely move - it pays for each function’s code once per stage, not once per item, so growing the batch past that fixed cost is close to free.
Why the compiler won’t do this for you #
Turning fused into staged is a known loop transformation - loop
distribution - and both GCC and clang implement it. Neither applies it
here, even at -O3, with link-time optimization and every op marked
__attribute__((const)): GCC 12 and clang 18 both emit one loop with 96
calls in it. Their cost models think about vectorization and data
locality; none of them estimates whether a loop body’s code fits in the
instruction cache.
So staging is a design decision, and not a local one. It decides whether work flows through the program one item at a time or in batches, and that shapes everything around it: function signatures that take arrays instead of single values, buffers between stages, how errors and early exits are handled. It’s cheap to choose early and expensive to retrofit, which is why the systems that depend on it are built around it from the start.
Where this shows up outside a microbenchmark #
Nobody writes a 96-function synthetic pipeline by accident, but “many small handlers, dispatched across a large batch, more combined code than fits in L1i” is a real production shape, and there’s a well-known system built directly around avoiding it: FD.io’s VPP (Vector Packet Processing, originally from Cisco, now a networking dataplane used widely enough to be the basis of multiple routers and vSwitches).
VPP structures packet processing as a directed graph of small
nodes - dpdk-input, ip4-lookup, and so on - and processes an entire
vector of packets through one node before moving to the next, instead
of running each packet through the whole graph individually. The project
is explicit that this is an instruction-cache decision: each node is
deliberately kept small enough to fit inside L1i, and because the first
packet in a vector warms that node’s code up, every packet after it in
the same batch runs against an already-hot cache. That’s “staged,” at
production scale, built for the exact reason this post’s benchmark shows
a 3x gap.
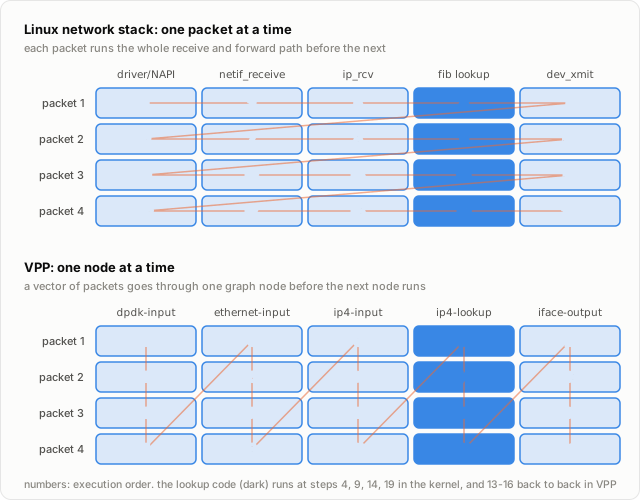
Fused vs staged, in a router. The kernel side is simplified: NAPI already polls packets from the driver in batches, and since 4.19 the early receive path can pass lists of packets along, but most of the stack still runs one packet at a time.
So, what #
The honest moral here isn’t really about instruction caches. It’s about the first measurement I believed. A 3x gap with a plausible-sounding explanation is still just a plausible-sounding explanation until a second, independent counter confirms it’s actually the mechanism you think it is. Branch misprediction and icache pressure can produce numbers that look the same from a distance - a stopwatch in one hand and a theory in the other, and nothing stopping you from pairing them up wrong.
References #
- FD.io VPP - Software Architecture - graph-node design and the instruction-cache rationale behind vector processing
- FD.io VPP - Scalar vs Vector packet processing - the scalar/fused vs vector/staged comparison directly
- darfire/bloggy-code - icache-pipeline - full benchmark code, generator script, and
bench.shfor the numbers in this post